Half Time Statistics for Coastside Real Estate 2016 vs 2015 – January to June
A moderate increase in sold prices is consistent with the 2016 economic reports that I have been reading for months. As the next generation begins to look for their first home and may find themselves priced out of San Francisco, neighboring towns are being noticed.
Who is coming and going? Boomers are evaluating their lives with an eye towards the future, as parents pass on and children leave the family home. The Coastside becomes the “my turn” place for many individuals and couples where a desire for a slower paced life or the fun beach house can now take priority. Some people who have lived here for a long time, leave the Coastside to be closer to out of area family or for financial reasons. Many move here to raise families amid our stunning natural beauty and small town community caring. First time home buyers do buy here, but in fewer numbers as prices continue to rise.
Here are the basic changes for the Half Moon Bay Coastside communities, Pacifica, and the South Coast communities, separately for single family homes and condo/townhouses.
Quick takeaways for our San Mateo County Coastside market are:
- Sold Prices are still rising, though not as quickly as last year.
- Inventory is still low, meaning it is still generally a Seller’s market.
- Homes are taking a little longer to sell this year than last year.
- Half Moon Bay condos are selling for the highest prices to date.
- A larger number of higher end homes have sold in Pacifica this year so far than last year.
Single Family Homes – Half Moon Bay, El Granada, Moss Beach, Montara
Median Sold prices increased by 4% over last year at the same time, now $1,080,000. This is also encouraging more sellers, especially at the high end to sell their homes. The biggest increase is the number of Coastside high end sales – $1.5 Million and up. Currently this market of single family homes in all price ranges between Half Moon Bay and Montara has about 2 months of inventory. (a)
The biggest decrease was the number of homes sold for under $1 Million. This 20% decrease represents a smaller number of “entry” level homes, making it harder for mid-income earners to get into homes here. To purchase a home in the median price range now, with a standard 20% down, the monthly principal & interest payment is in the $3700-$4000 range as an estimate. This requires $140,000 or greater gross income range if 35% is dedicated to monthly housing, which should include taxes and insurance also. Don’t take this info as your particular range…there are many factors and more loan options available now than a few years ago. It’s a general guide as to what to expect.
The message behind the numbers for me is that while properties are continuing to sell in a short period of time, there are sprinklings of caution in the market. One example being an increase in the amount of time a property is on the market and that we’re also seeing more price reductions recently.
(a) Graph showing the number of months of all available homes for sale in Half Moon Bay, El Granada, Moss Beach, and Montara currently: Two months, indicating overall still a Seller’s Market.
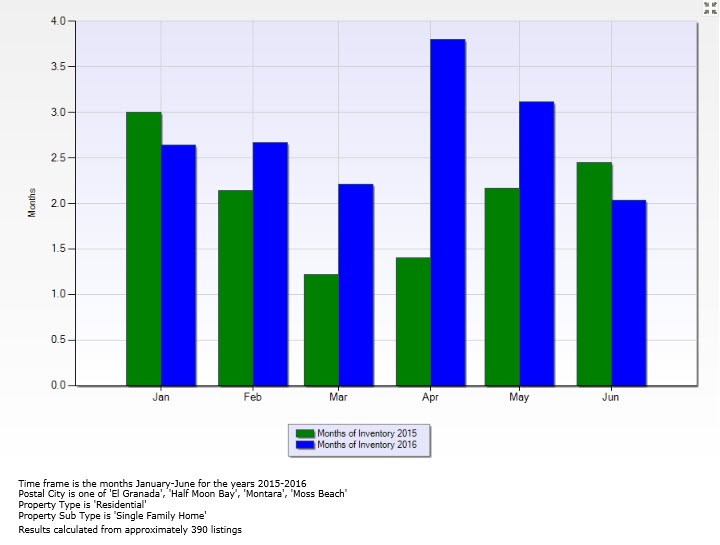
Months of Inventory means: how many months it would take for all the current homes for sale on the market to sell, if no new homes became available. Four to five months of supply is average: if the number is smaller, this means that buyers are dominating the market and there are relatively few sellers, a “Seller’s Market”. The greater the number, this means there are more sellers than buyers, a “Buyer’s Market”.
Condo/Townhouses – Half Moon Bay (note: there are no condos north of HMB until Pacifica)
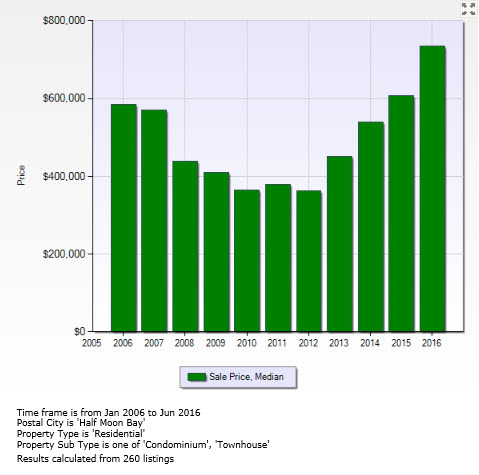
The under $600,000 entry level price point continues to disappear with a decrease in sales in this price range from last year by 28%. Overall Median Sold Prices increased a whopping 29%. Condos as a replacement for a detached house are still hard to come by here. The highest increase was for condos and townhouses that sold for over $700,000. With market timing also decreasing to 25% faster sales, this is still a seller’s market. (b)
(b) Graph showing Half Moon Bay Condo and Townhouse sales between 2006 and 2016 (through June) showing sales prices now having surpassed the last sold price high in 2006.
Single Family Homes – Pacifica – all neighborhoods
Homes selling for over $1.5 Million increased 400% and overall Median Sold Prices increased 8% over last year at the same time, at $857,500. This tells me that people finding the mid-Coastside communities too expensive are going north. Homes selling for under $1 Million decreased significantly, by 20%.
Condo/Townhouses – Pacifica – all neighborhoods
Units sold for under $600,000 decreased by 61% and units sold for over $600,000 increased by 35%, yet keeping the overall Median Sold Price increase to a similar 8% to the single family home market. Marketing times remain short for these units with a decrease in the days on market.
South Coast – Loma Mar, Pescadero, San Gregorio, La Honda
Median Sold Prices increased from last year by 6%. Time to sell homes is roughly the same as last year – slightly longer – even though there is a big drop in the number of homes sold, down 39%. Inventory remained low until June, when a few more properties came on the market. There is a wide range of prices and properties, including farms, small country properties, as well as single family homes, but no condo/townhomes are located in these areas.
My overall analysis is that 2016 remains a healthy year, just not as frenzied as last year. An example one agent shared is “we had two offers now instead of ten”. Depending on the price point, the Coastside has seen 3-5 five offers for its hottest properties within the past year. As examples… A home in the $800K=$900K range this spring had 4 offers. That same property now may receive 2-3 offers. This is one way I take the temperature of the market on a weekly basis.
What does median and average mean in regard to home prices?
Median price = 50% of sales are above and 50% are below the median sold price. Average price = all home sale price added together and divided by the number of sales. These numbers can be very different.
If the median sale price of homes is going DOWN, it is because homes on the lower end have the biggest turnover (sell faster) and homes on the upper end (that tend to increase the average price) sell more slowly. This can be affected by both sales speed and sales volume. Also, there are fewer upper end homes.
The actual NUMBER of homes in the highest price tier, say $2 Million plus, may be less than 10. So, one sale at $3,000,000 moves the AVERAGE up pretty quick. But this does NOT mean you can sell an upper tier home faster than a home below the median. Example: the highest price home to sell in the Jan-June 2016 period was for $3,450,000 in Montara, and it took 92 days to get an accepted contract.
TO RECEIVE THE DETAILED STATISTICS REPORTS WITH SEVERAL CATEGORIES AND CHANGES for January – June 2016 versus 2015, please complete the contact form below and I will email them to you.