Purchase Loan Interest Rate Trends – June 2013
The rates are still very low, not news. The Big Headline stories this Spring are that rates are now going up.(i) To shed some perspective, here are three graphs covering purchase loan interests rates over the last 3 months, 3 years, and 20 years. Are we past the bottom in terms of the lowest the rates can go? Maybe. Time will always tell and it’s only with hindsight that we gain wisdom. Realtors have a Real Estate license that does not include a crystal ball, unfortunately. What we do have is experience of current activity, experience of past trends, and the ability to analyze these past and current forces as they apply to YOUR real estate goals.
For now, this is where rates have been in the last three months. You see that the low mark was in May, which is why the headlines are talking about rate going UP. The impact of “Up” is relative as we look at rates over a period of time below, and we knew they would rise again at some time. Pay attention to what your monthly payment will be; see 2006 and 2013 Scenarios below…
THREE MONTH TRENDS:
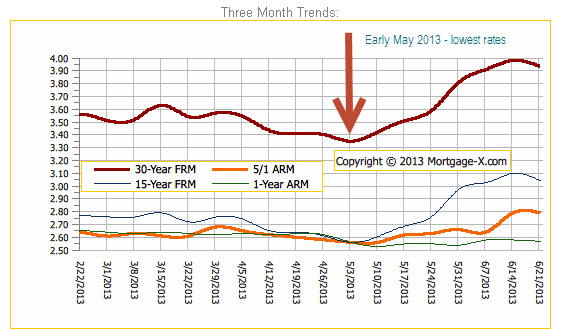
Reproduced with the permission of Mortgage-X.com
(Note: I inserted the arrow and the “Early May 2013…” comment in the above graph.)
THREE YEAR TRENDS:
Reproduced with the permission of Mortgage-X.com
TWENTY YEAR TRENDS:
Reproduced with the permission of Mortgage-X.com
SCENARIOS – 2006 and 2013:
| Purchase Price | Loan Amount | Interest Rate | Monthly Payment |
| $800,000 | $640,000 (20%) | 6.25% (2006) | $3940.59 |
| $800,000 | $640,000 (20%) | 4.50% (2013) | $3249.79 |
Given all this, what is different and what does it mean for Coastsiders?
If knowing where the Half Moon Bay – Coastside market stands right now in relation to a period of time in the past is helpful, let’s look at it compared to June 2006. What’s changed?
1) Homes are selling faster now. Days on market is around 23 days now compared to 50 days then. Less than a month on the market confirms the brisk activity we’ve been seeing.
2) The buyers are getting more house for the money now, which will still be the case if the rates go up a little bit more. In 2006 the average price per square foot was $505 and it is now about $448; about 11% less.
3) Prices are still lower right now by 20% from 2006. The average sale price in 2006 was $974,236 and now it is $778,886, for roughly the same sized house. Average sold size in 2006 was 2000 sq. ft. and now it’s about 1850 sq. ft.
4) Interest rates for purchase loans are about two percentage points less. On an $800,000 purchase price with 20% down payment ($640K loan) that equates to a monthly savings of $697.80 or 18% on principal and interest payments.
In a shifting market, it’s helpful to have access to your “team” of professionals prior to a purchase – Realtor, financial planner and/or tax accountant as you consider whether it makes sense to adjust your purchase price and/or loan amount. Remembering the goal, rate changes may or may not have any impact on what you decide to do. But it is important to be aware of the shift a few or several hundred dollars per month can make when looking at the big picture.
(i) some recent headlines:
Mortgage Rates Surge Higher…(SJ Mercury News, 5/29/2013)
How Rising Mortgage Rates Could Affect the Housing Recovery… (Forbes, 6/5/2013)